API Observer is designed to monitor services with millions of users, detecting and managing thousands of errors in real-time. This product plays a critical role in keeping tech systems stable and ensuring engineers can rapidly diagnose and resolve issues as they arise.
Given the complexity of monitoring multiple services and the high stakes involved in debugging critical errors quickly, the challenge was to create an intuitive, informative, and visually appealing dashboard that supports engineers in their tasks without overwhelming them.
Responsibilities
Year
2021
Tools
Figma, Notion, Whimsical
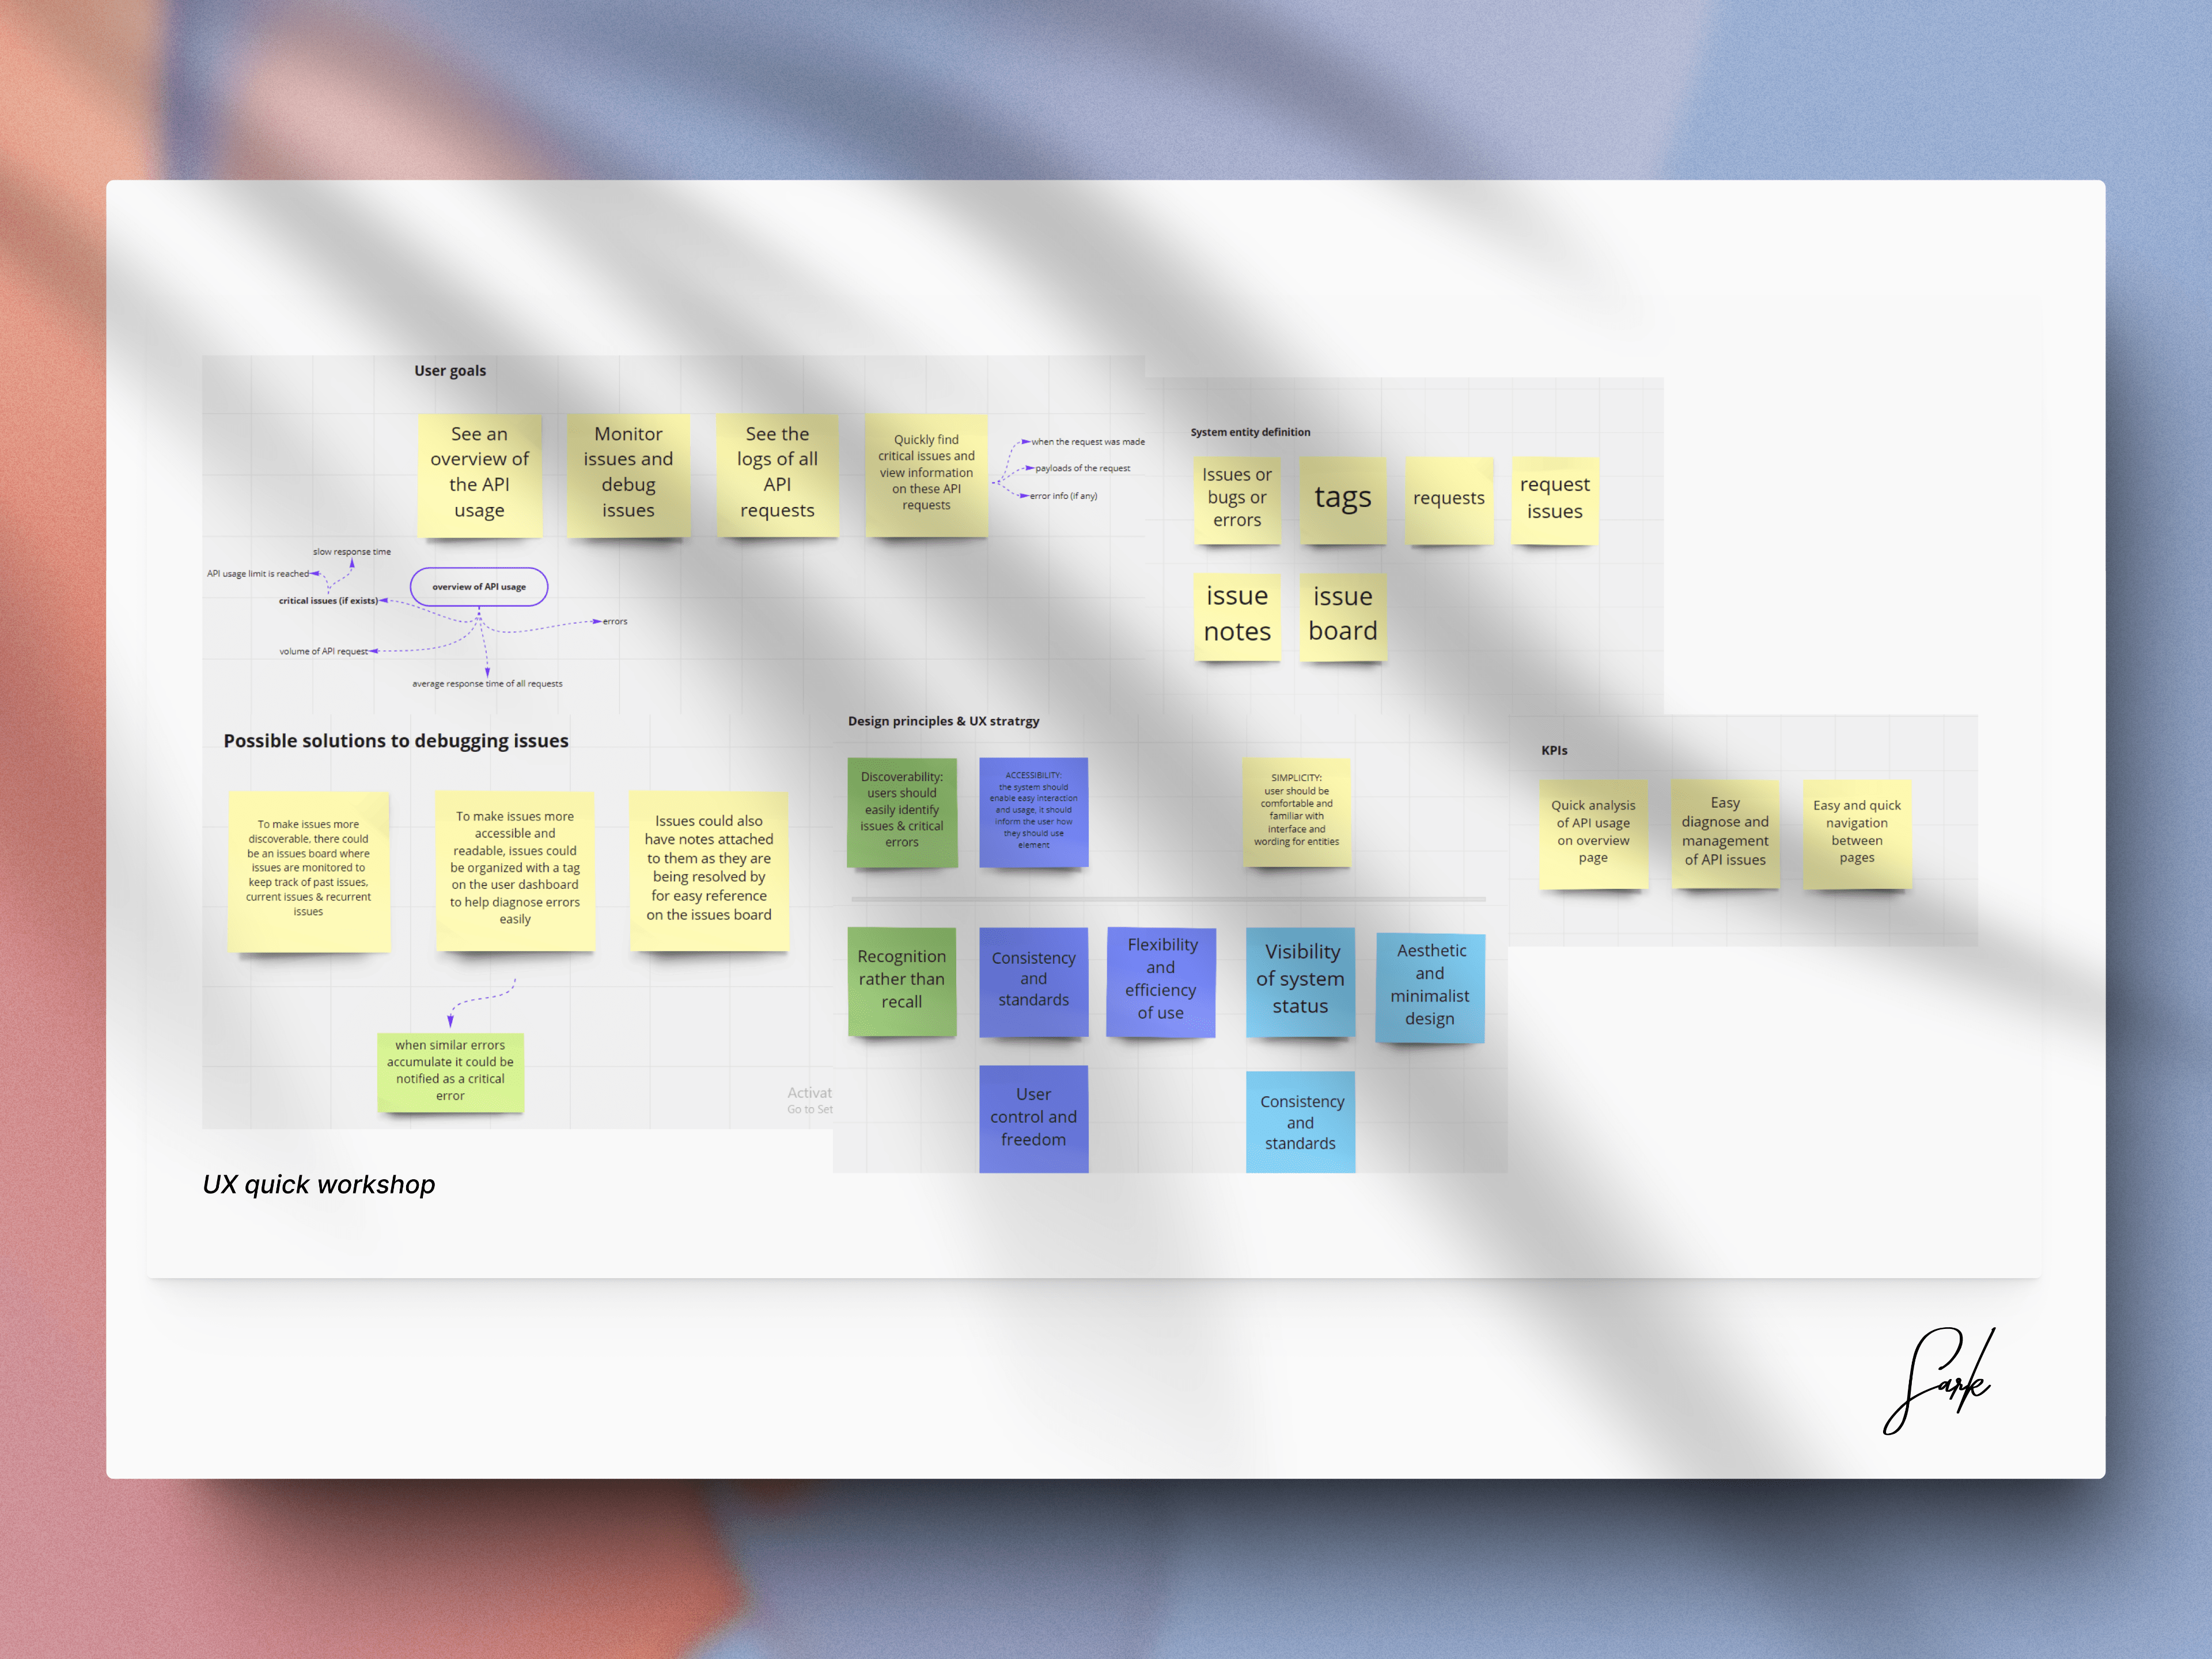
Project context and challenge
With thousands of requests and errors occurring simultaneously, the primary challenge was ensuring that engineers could easily manage this overwhelming flow of data without getting lost in noise. Engineers needed quick access to essential information, the ability to prioritize issues, and tools to streamline debugging.
Solution
- Information Hierarchy: We focused on organizing the interface with clear information hierarchies. The dashboard was split into critical components like the Issues Board and Request Viewer, allowing engineers to quickly navigate between key insights.
- Automated Tagging: To manage information overload, we implemented a tagging system that automatically grouped similar errors. This reduced redundancy, helped engineers focus on unique issues, and enabled faster resolution.
- Quick Navigation: By allowing engineers to jump directly from the high-level dashboard to detailed request information, we minimized steps and saved valuable time in diagnosing and resolving issues.
Project Goal
The primary objectives of this project were to:
- Conceptualize the Information Architecture: Organize the product's complex data in a way that is easy to navigate.
- Create a Sleek and User-Friendly Interface: Develop a clean design that balances comprehensive data presentation with simplicity.
- Enhance Usability: Ensure engineers can diagnose issues quickly, minimizing the time spent on error tracking.
- Develop Key Features and Components: Build tools that prioritize organization, efficiency, and error resolution.
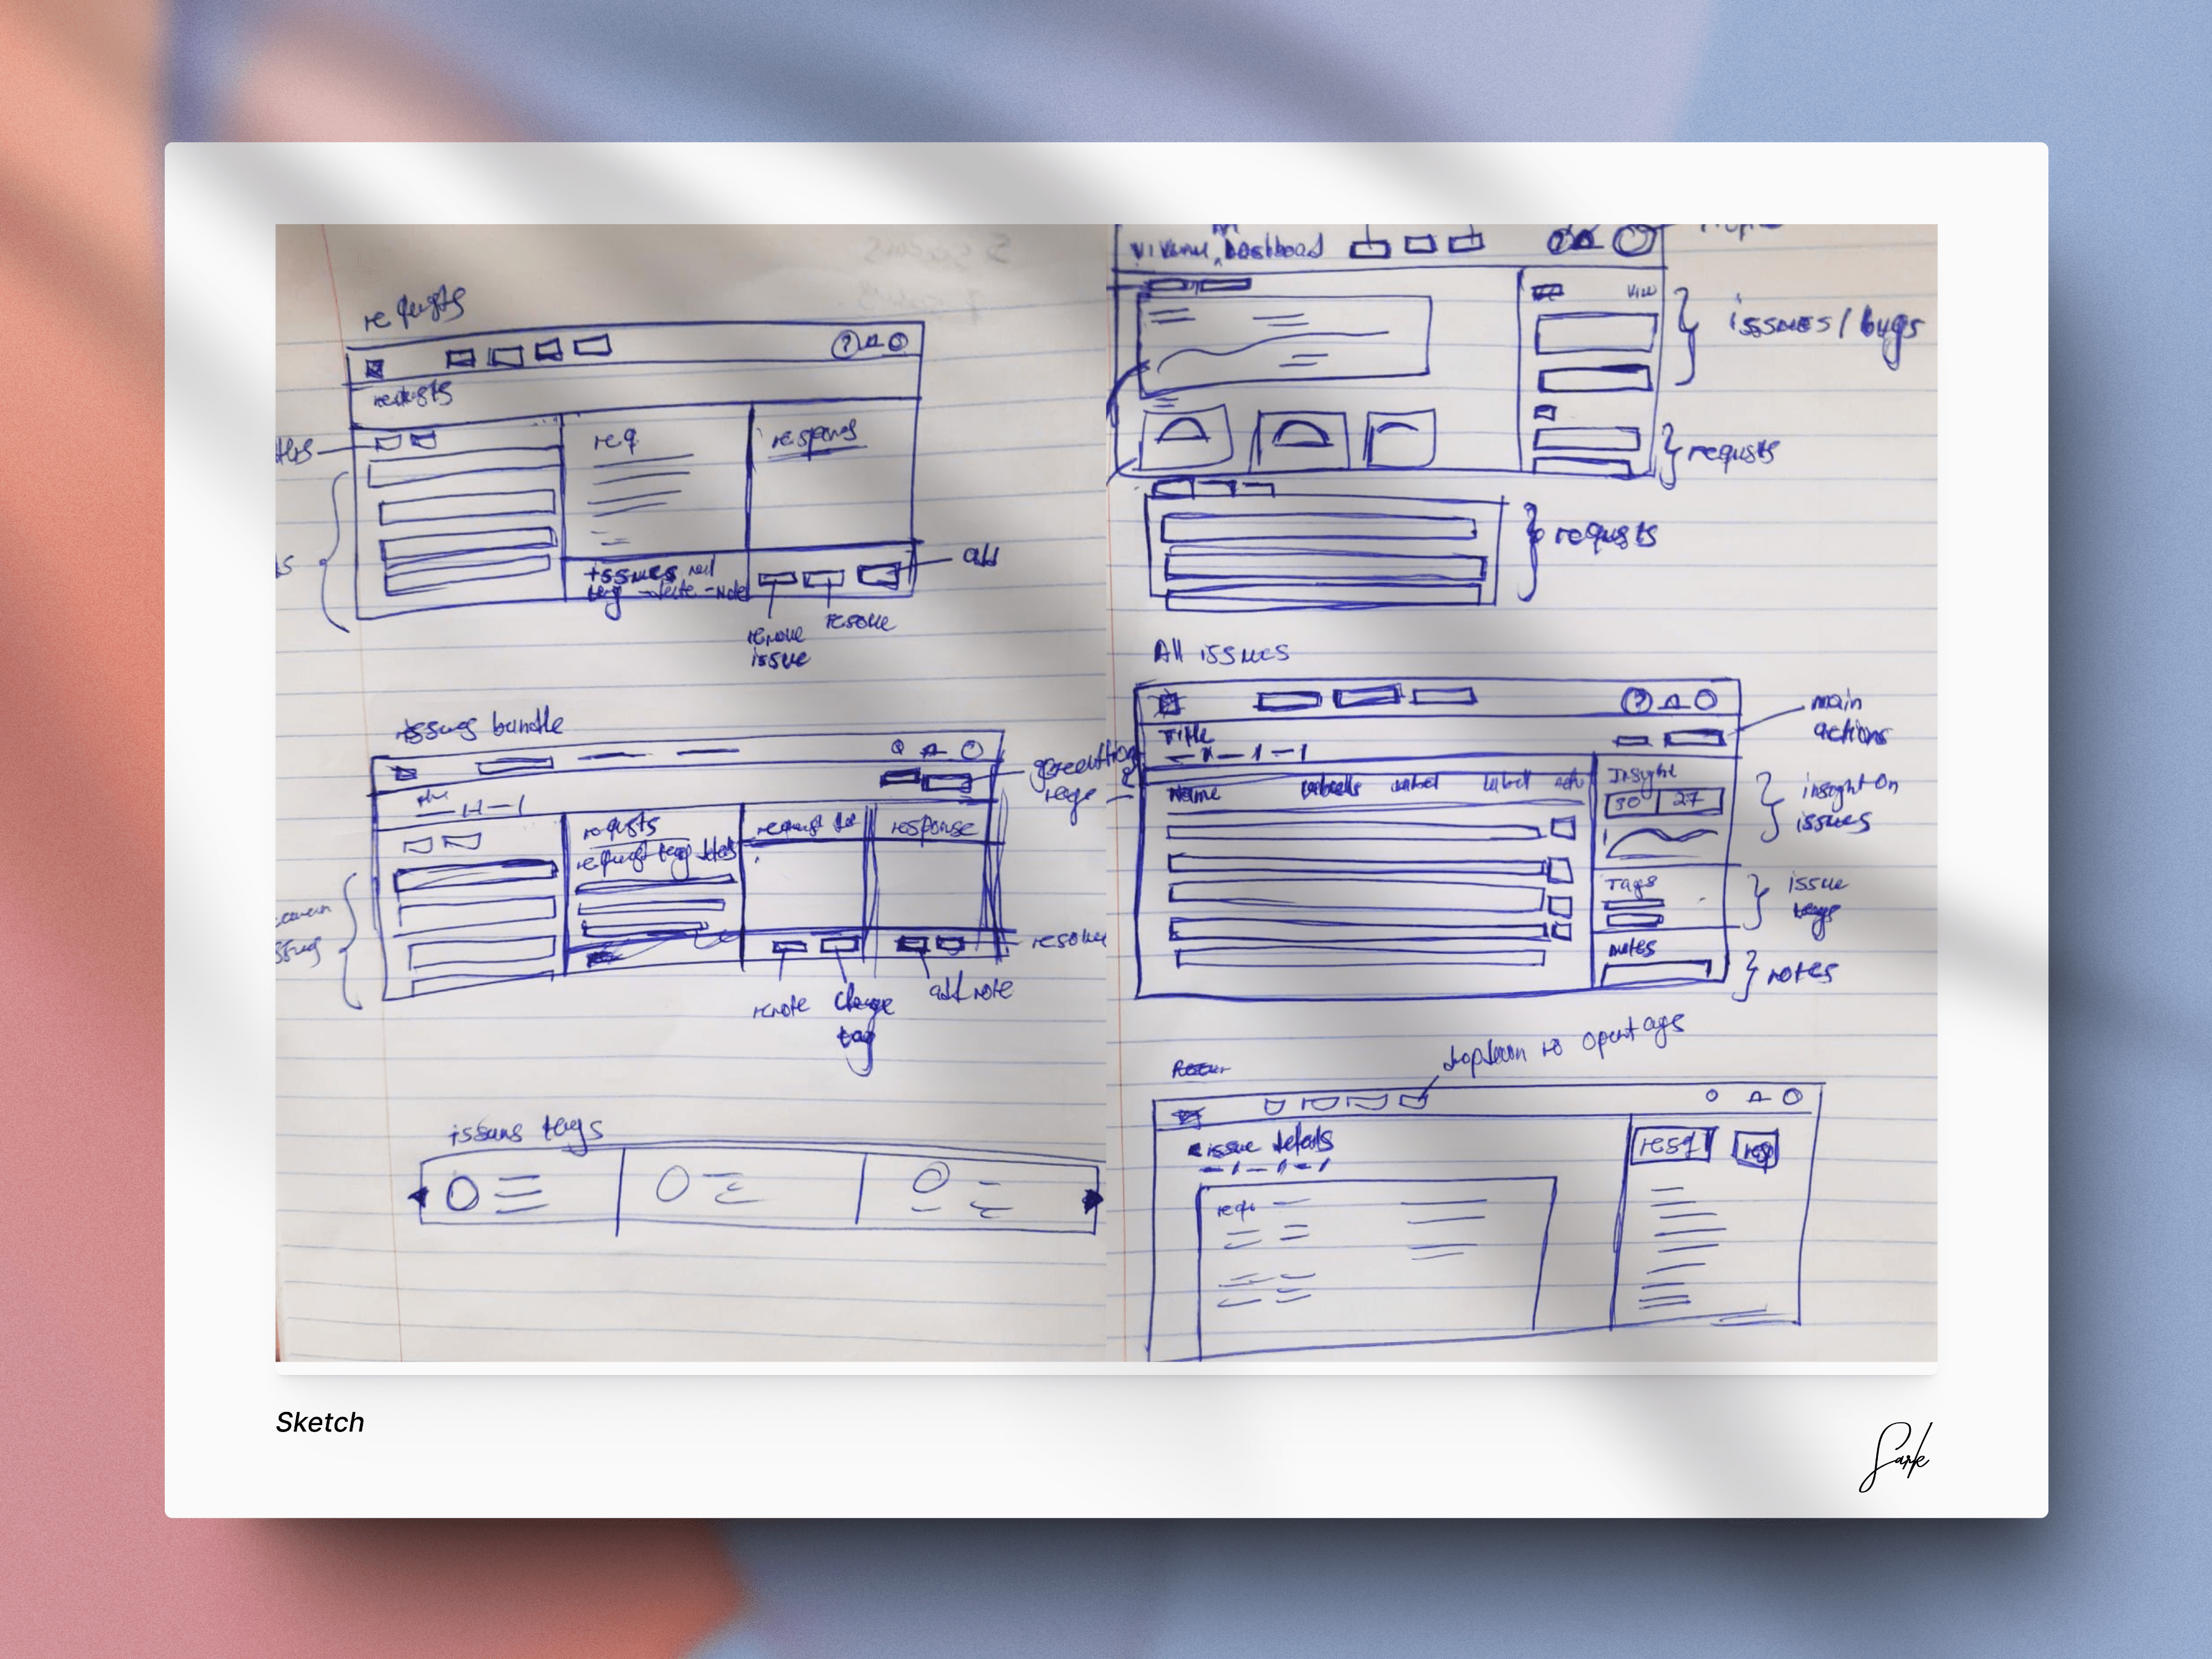
Design Process and Solutions
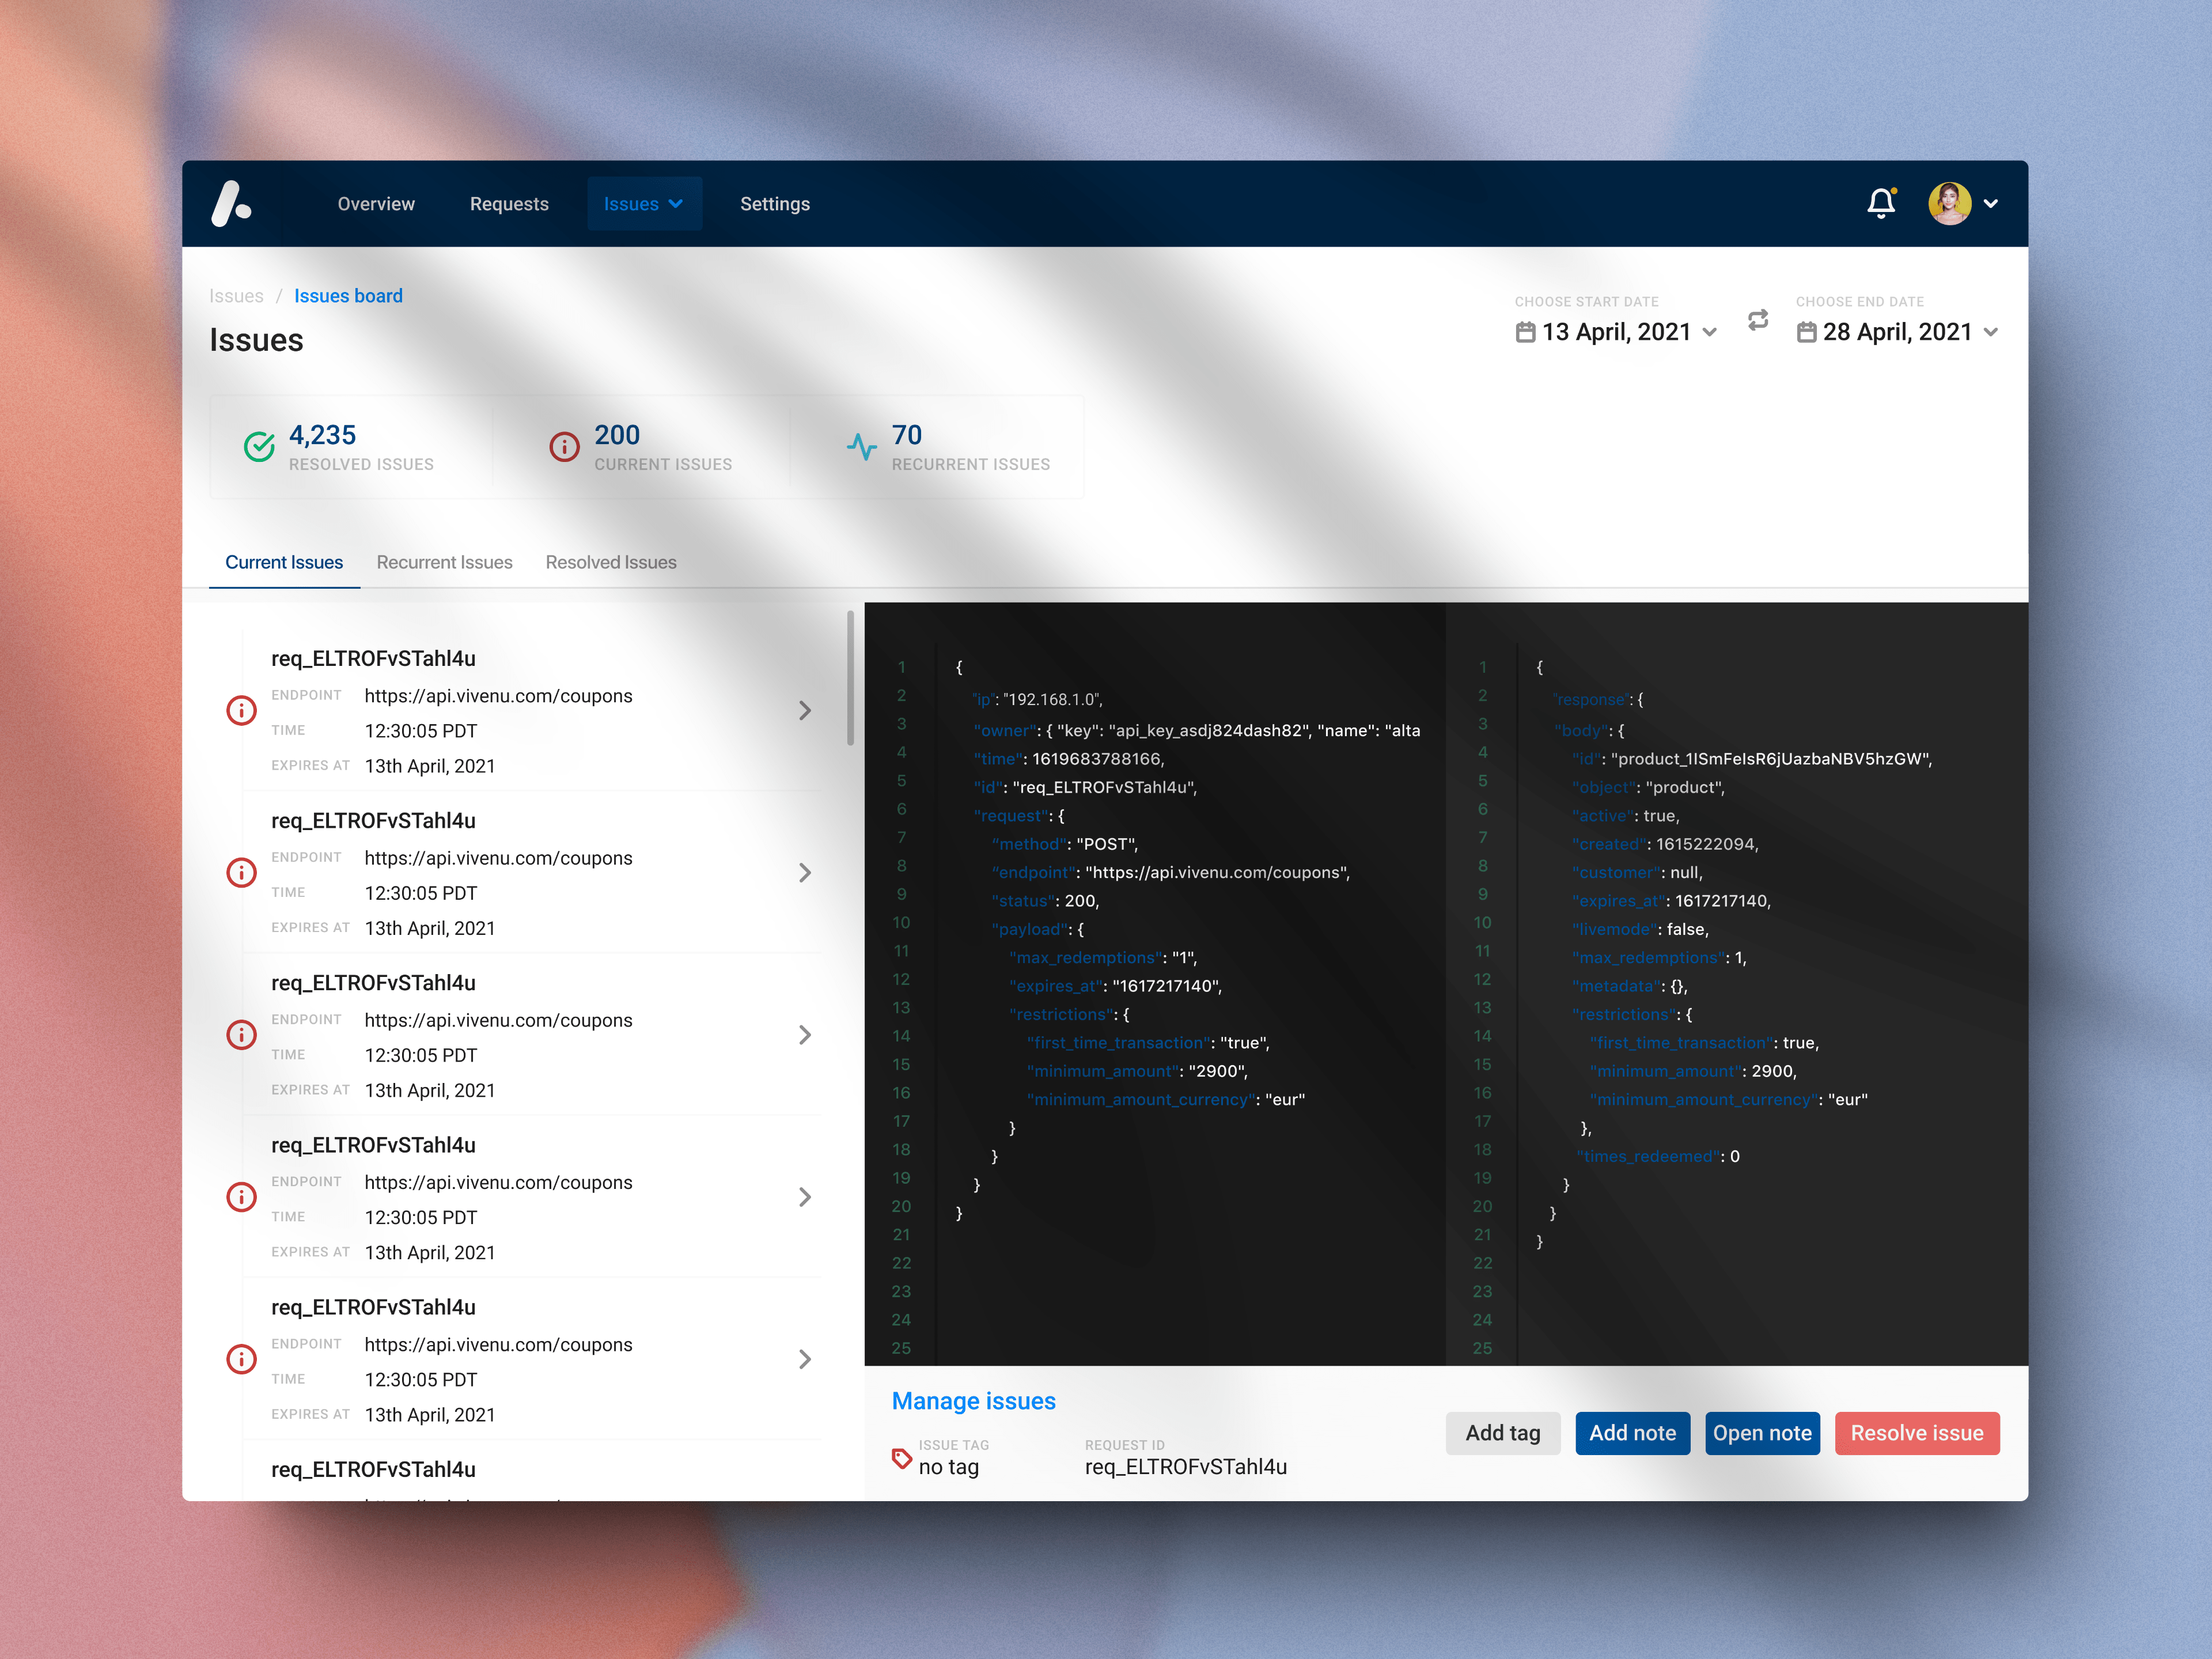
Issues Board: A Bird’s-Eye View of Errors
The Issues Board serves as a central hub for engineers to manage and track all ongoing and resolved errors.
- Overview of Issue Status: Engineers can see at a glance how many issues are resolved, ongoing, or new.
- Quick Access to Error Details: Each issue is tagged with relevant information like endpoint and time, enabling engineers to swiftly navigate to a detailed view of the request.
Automated Issue Tagging: Grouping Related Errors
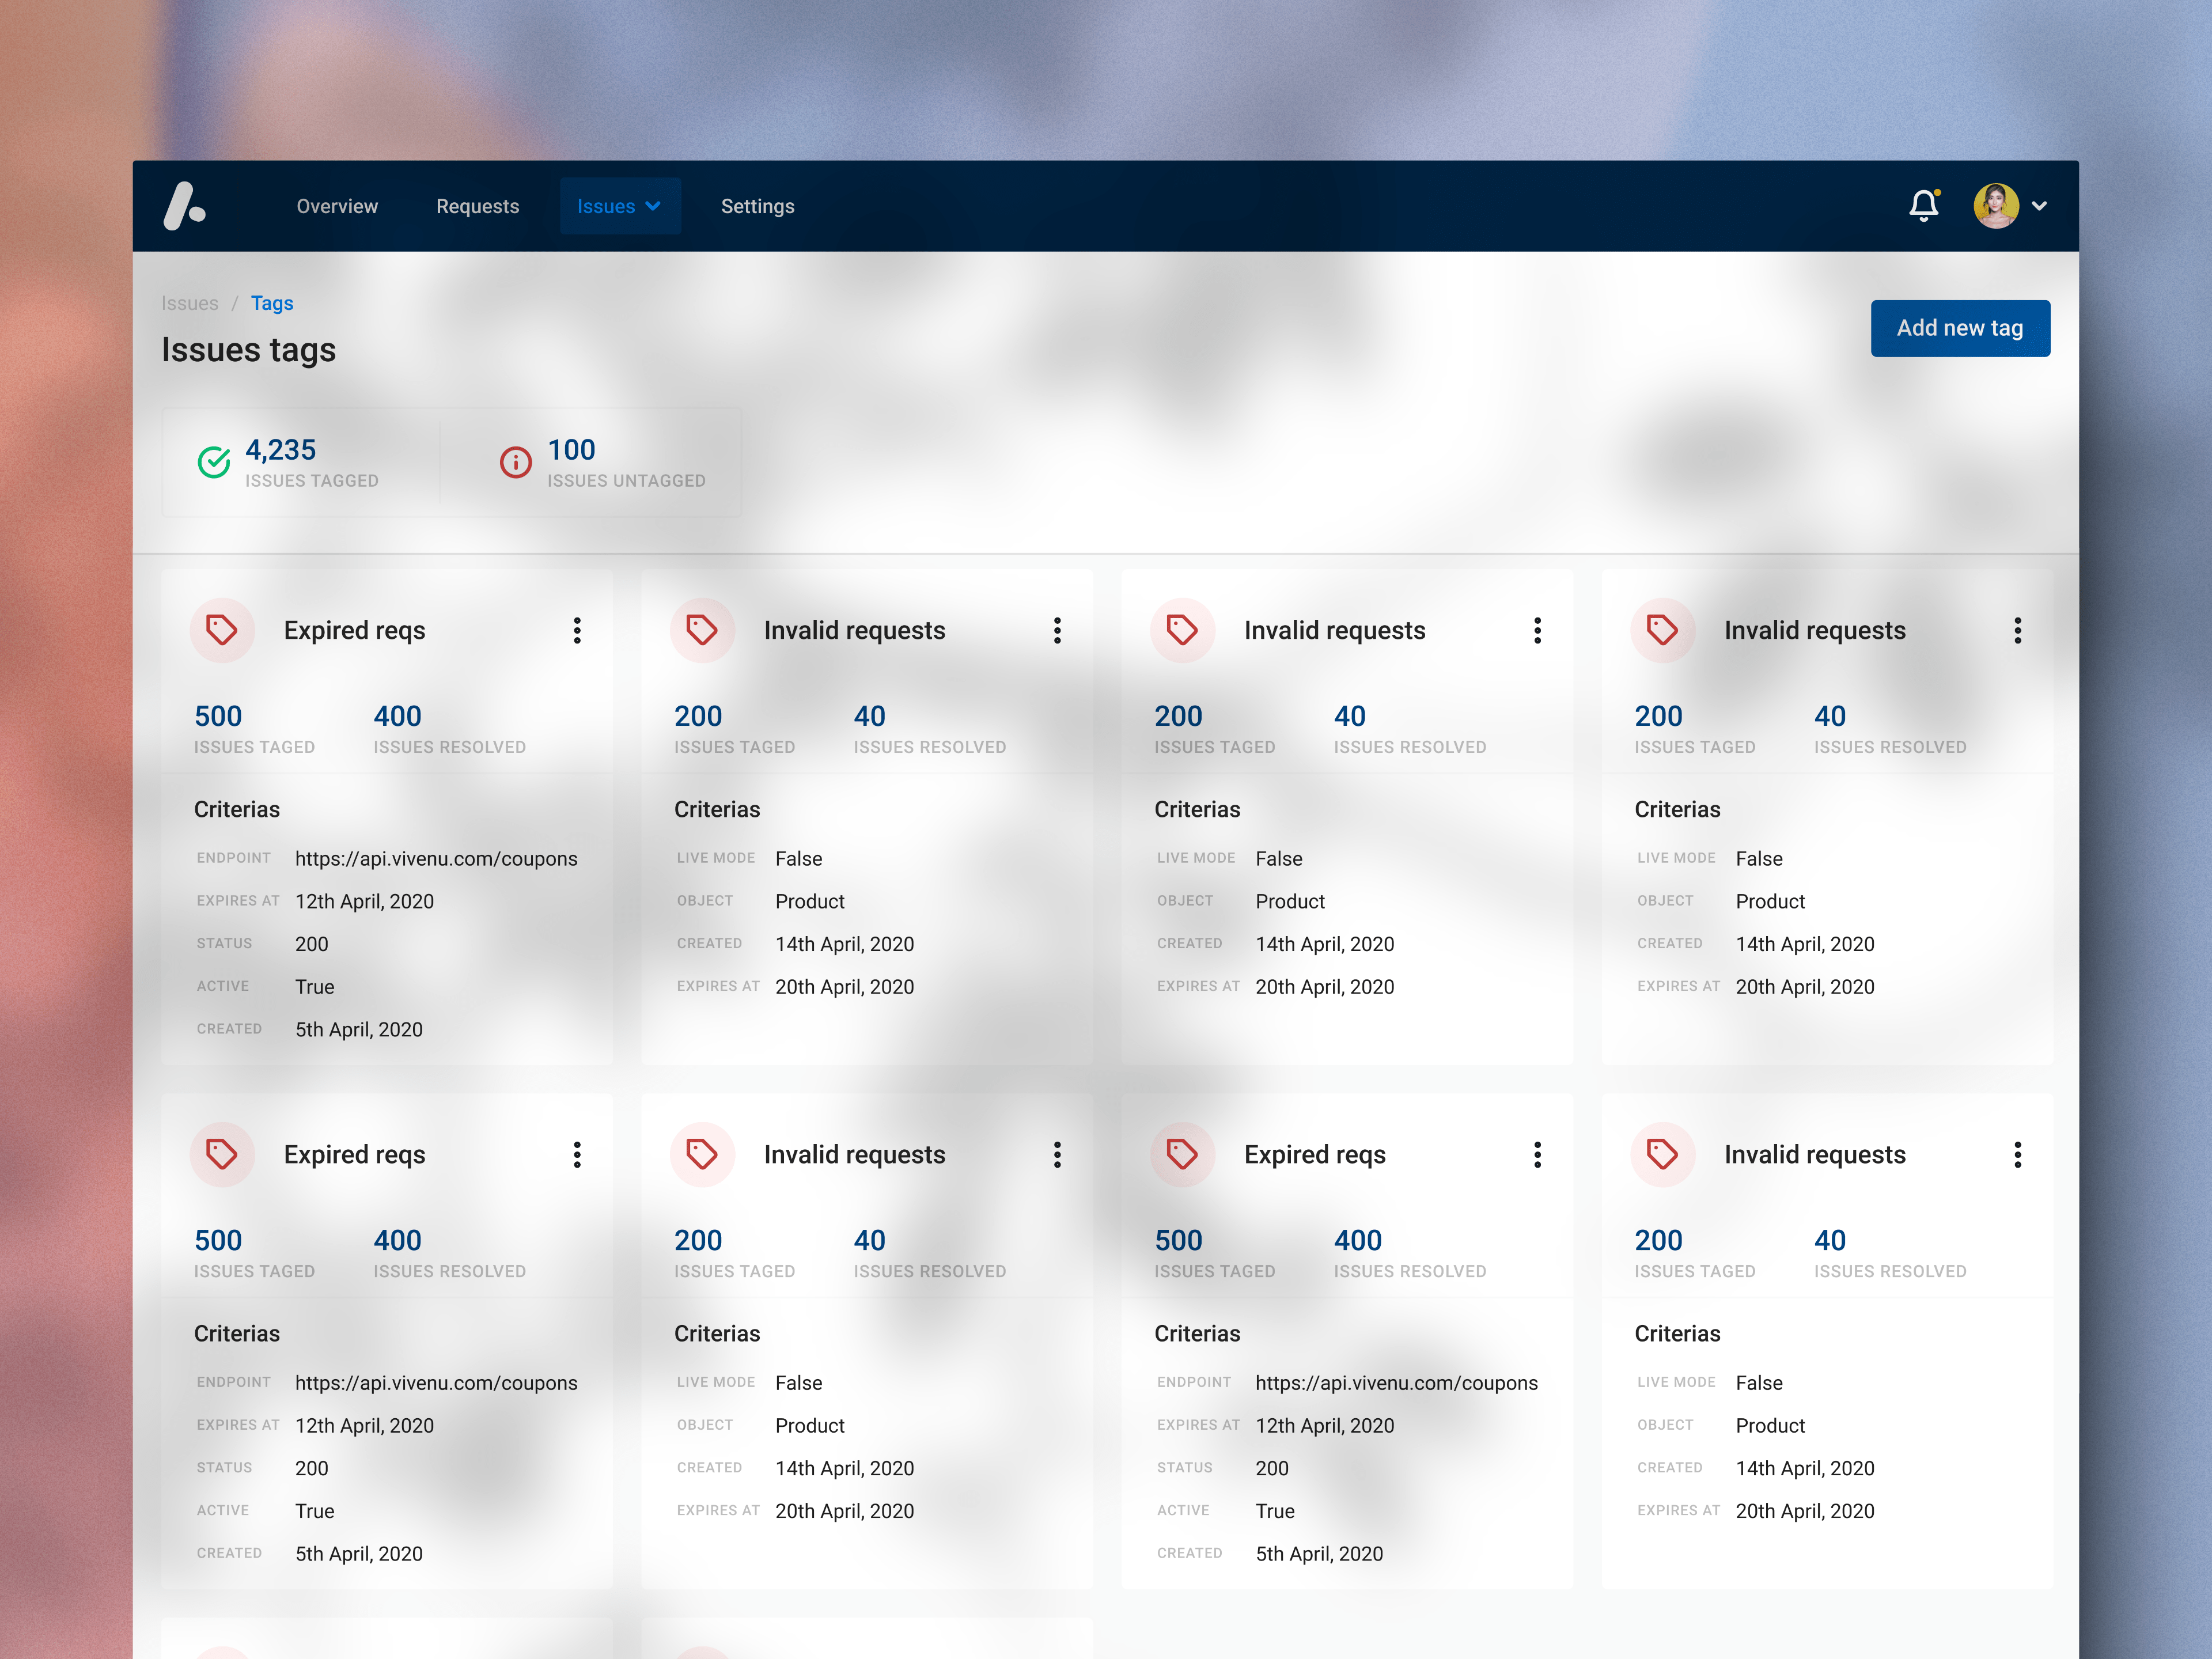
One of the key challenges when handling large-scale services is the sheer volume of errors. The tagging system was designed to:
- Auto-Organize Similar Errors: Group similar errors automatically, reducing clutter and enabling engineers to focus on unique or critical issues.
- Simplify Debugging: By clustering related errors, the system allows engineers to address root causes more efficiently.
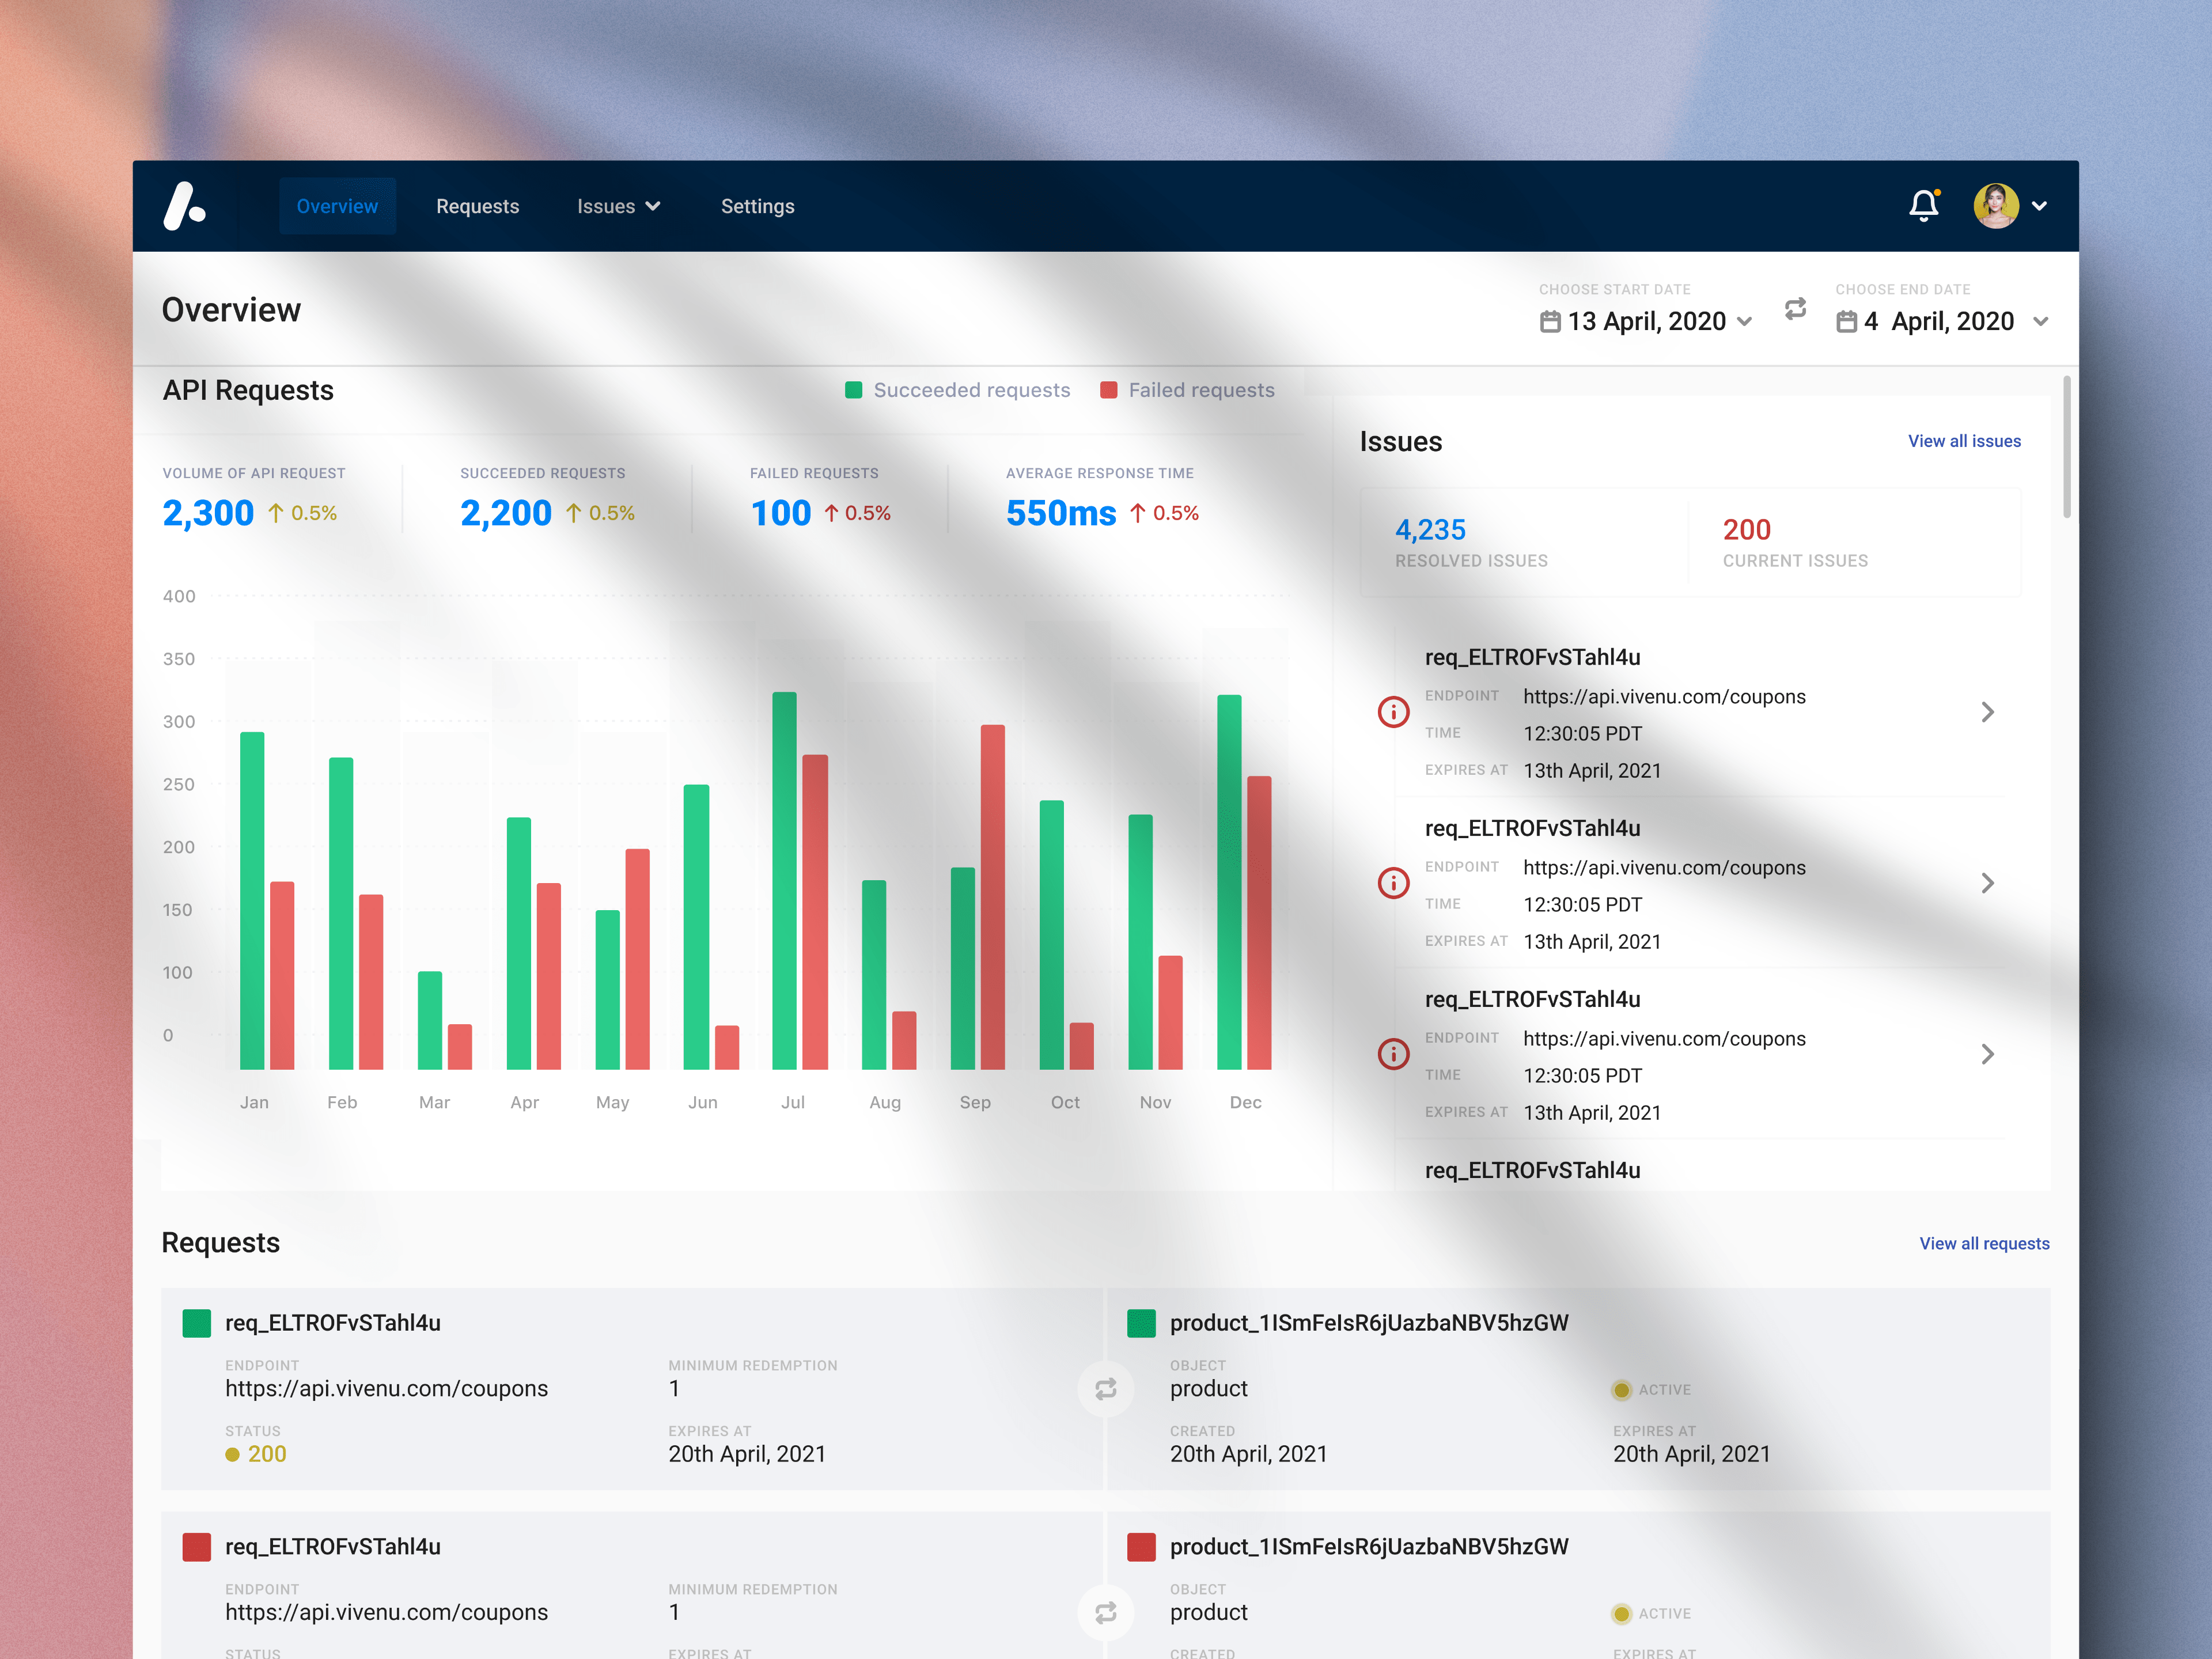
Request Component: Quick Request Insights
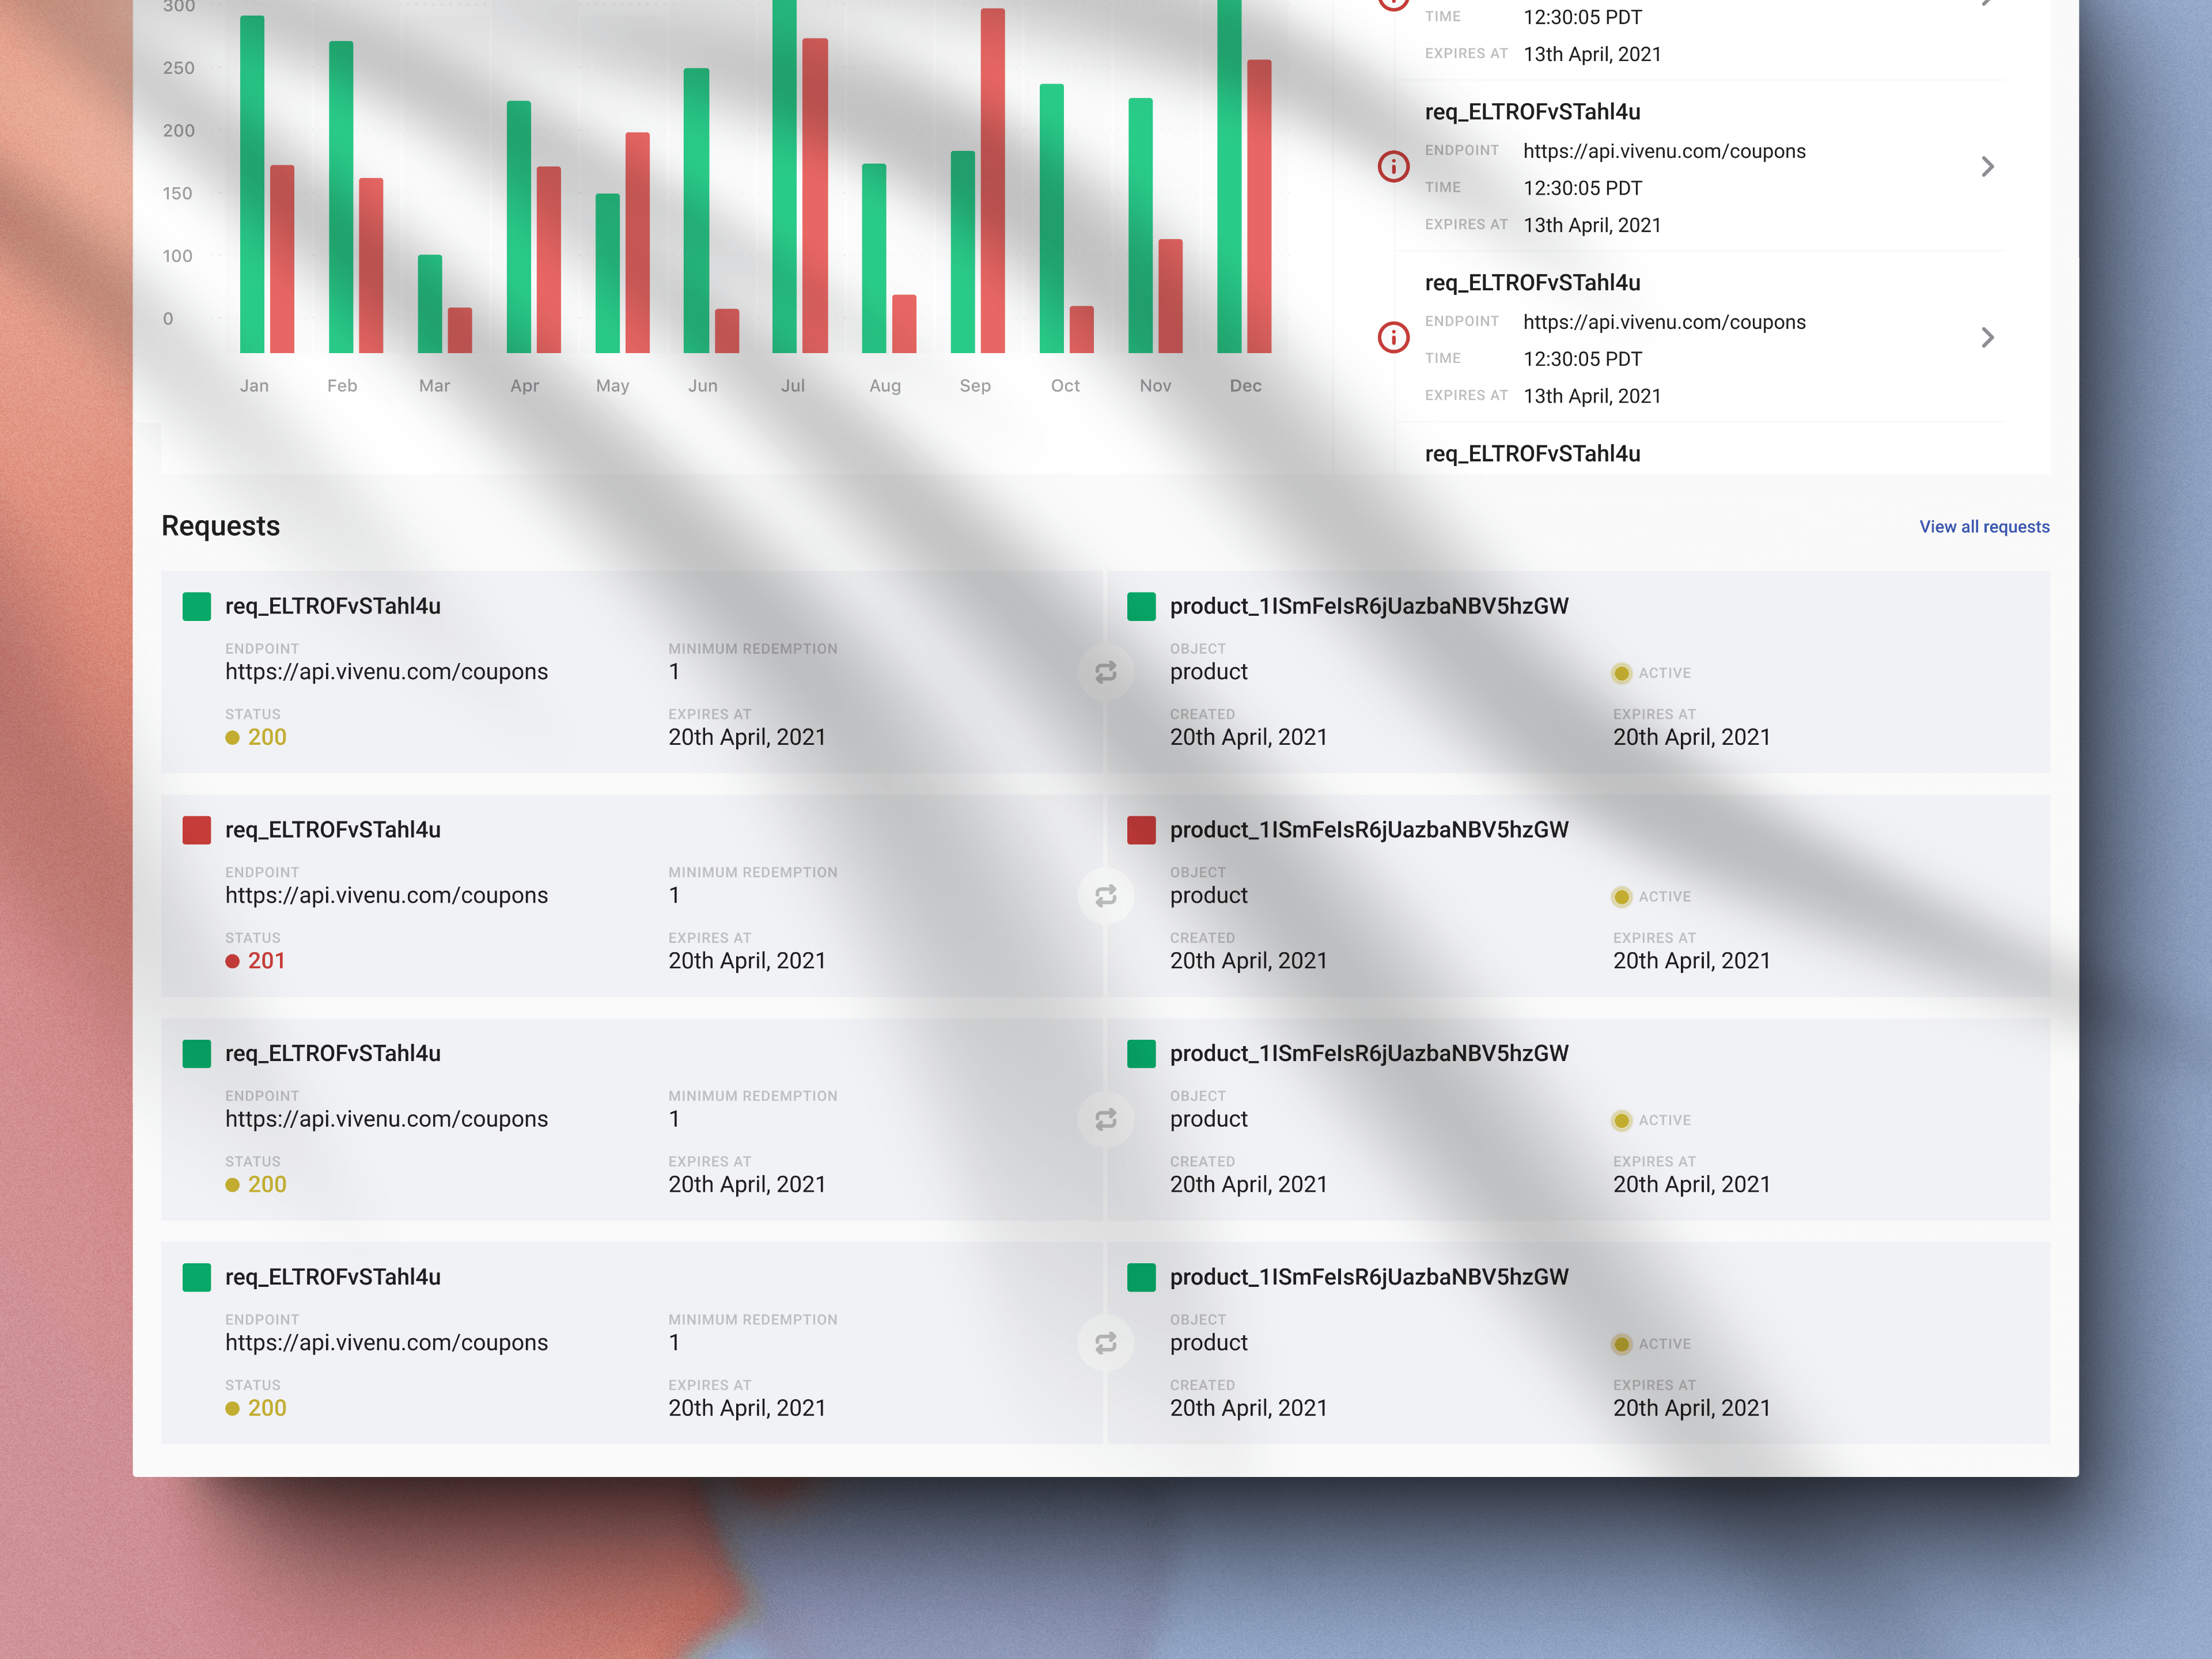
On the main dashboard, the request component consolidates crucial information regarding API requests and service statuses.
- Detailed Request Breakdown: Engineers can quickly see which services requests were sent to and their current status.
- Streamlined Navigation: This reduces the number of steps needed to diagnose issues, allowing engineers to resolve problems faster.
Detailed Request Viewer: Comprehensive Debugging Tool
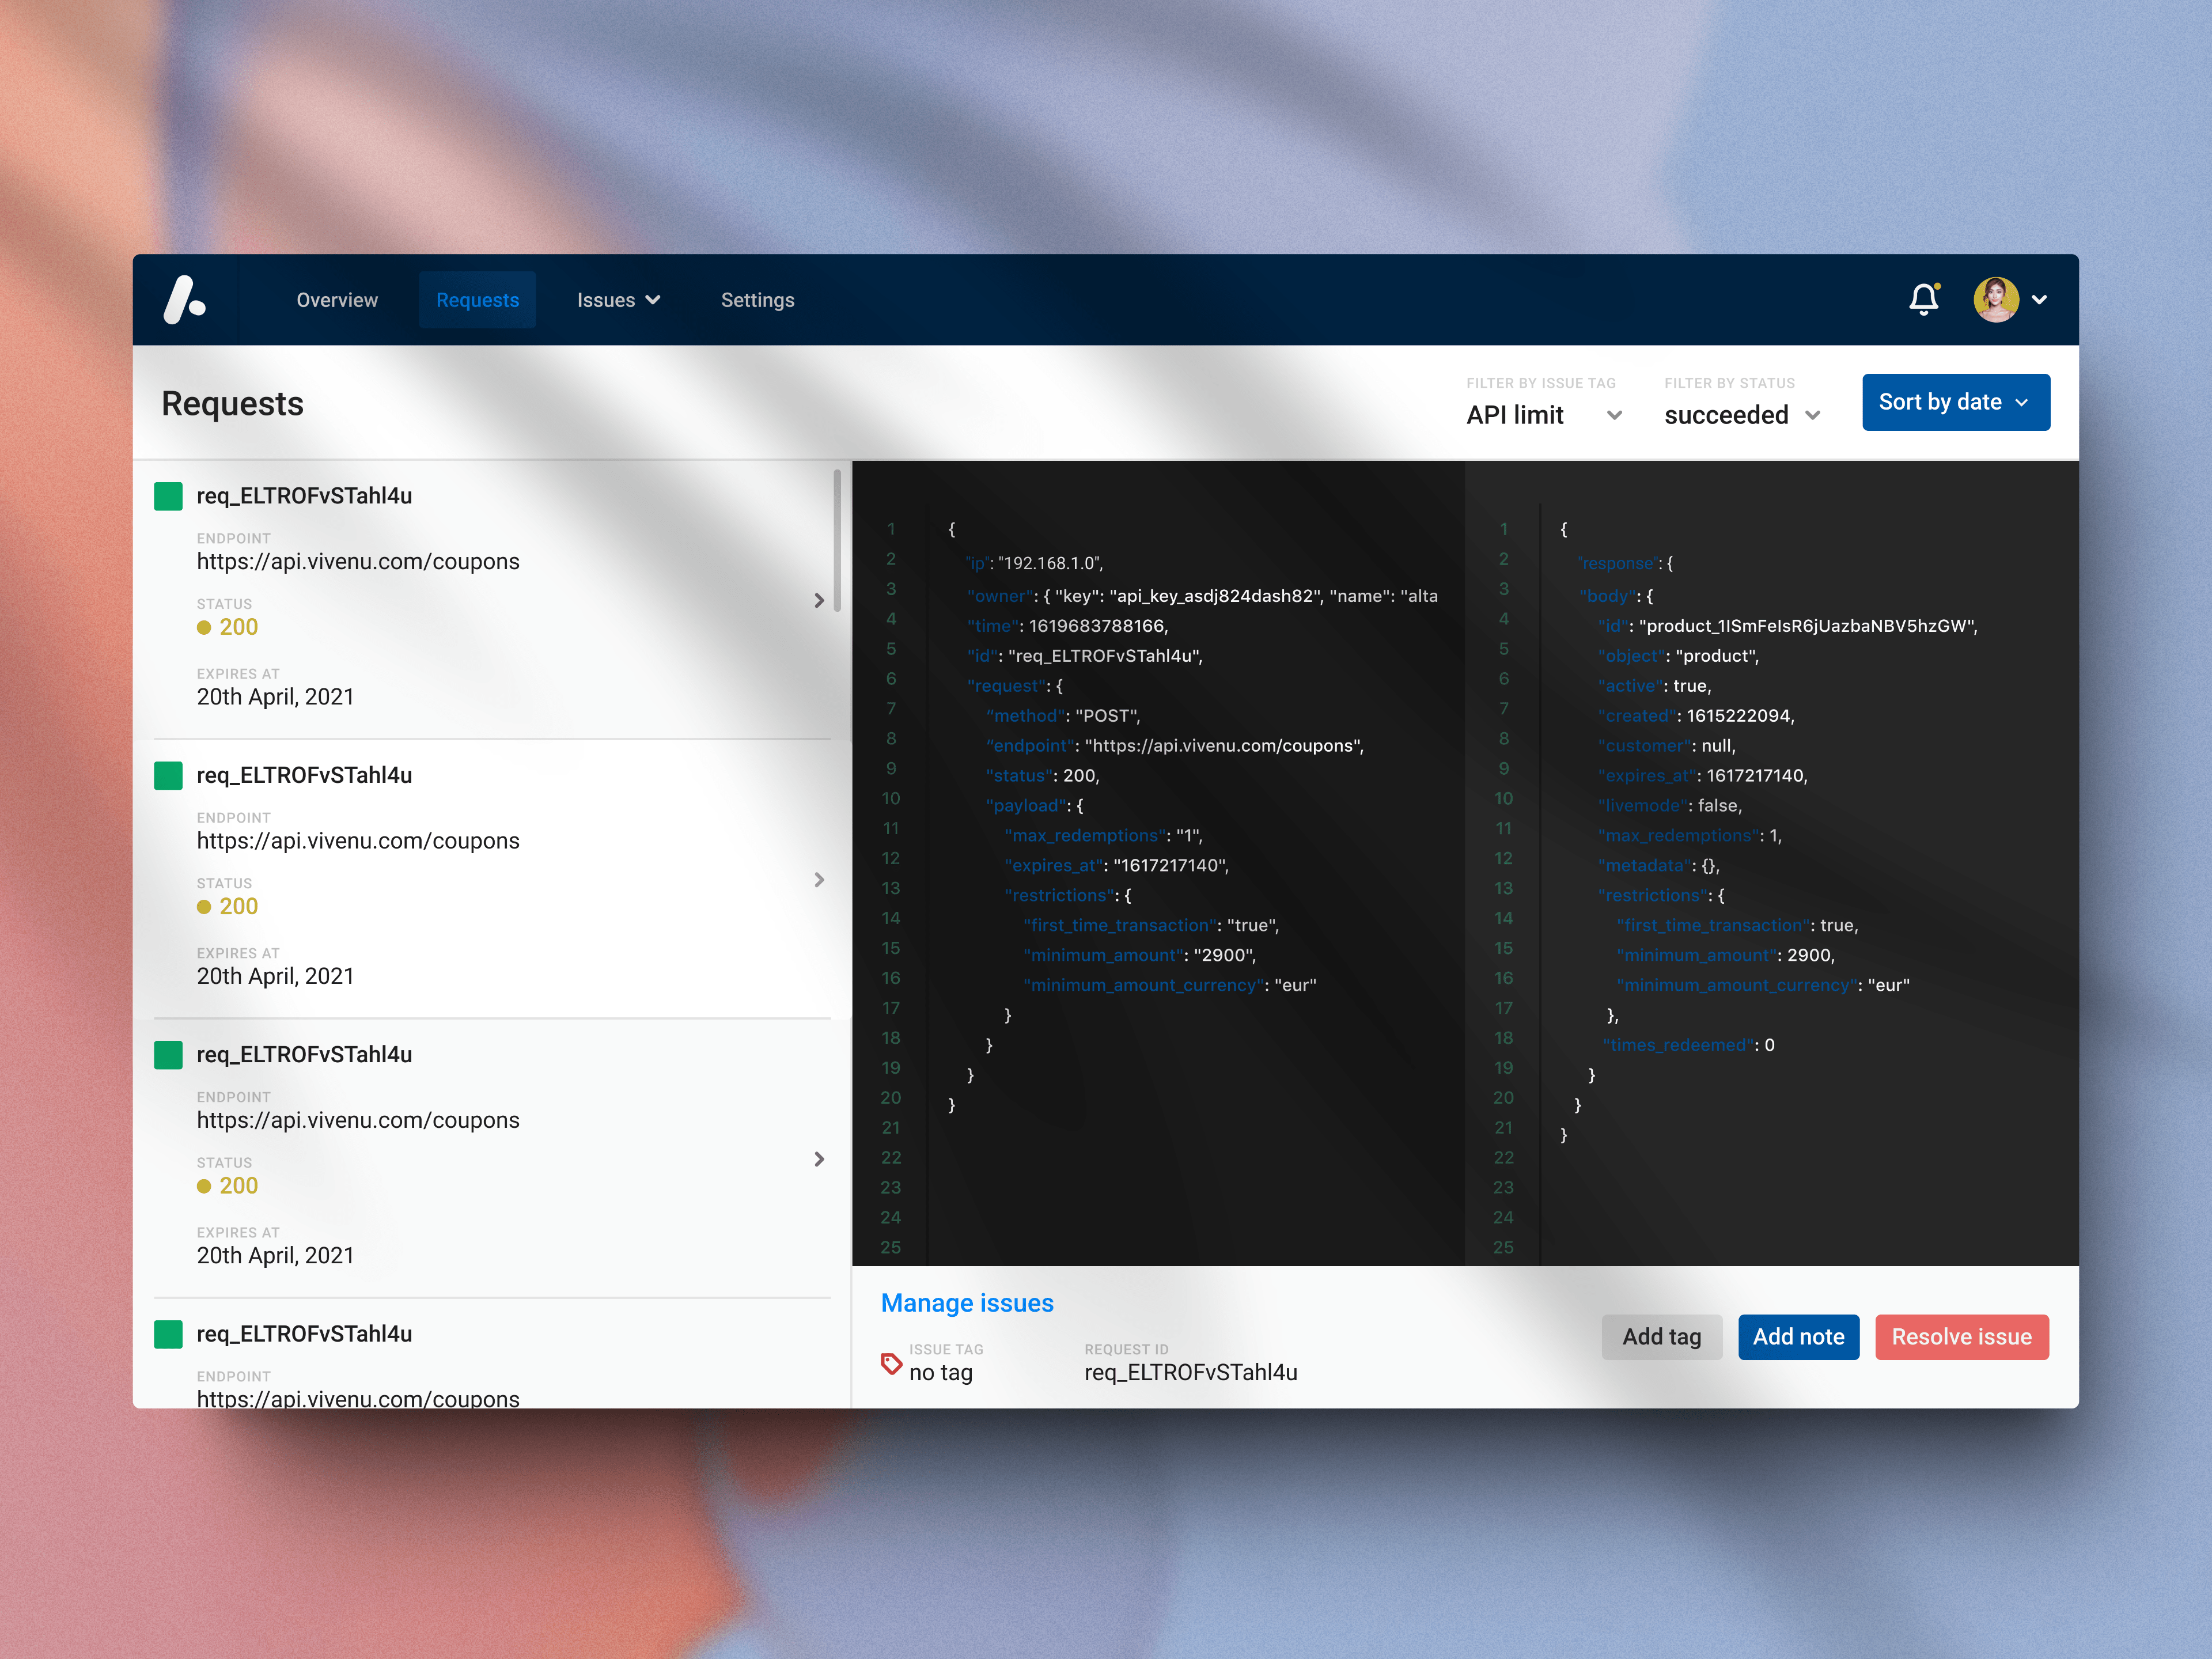
To support engineers in debugging specific requests, a detailed request viewer was introduced:
- Side-by-Side Request and Response: Engineers can view both the request and its corresponding response in a split-screen format, making it easier to pinpoint issues.
- Filter and Sorting Options: Engineers can filter requests by tags, status, or date, allowing them to zero in on the most relevant data quickly.
- Actionable Controls: From the request viewer, engineers can add notes, tags, or resolve issues directly, improving workflow efficiency.
Conclusion and final thoughts
The API Observer design was met with positive feedback from engineering teams who appreciated its clarity and efficiency. By focusing on information hierarchy, intuitive navigation, and smart automation, the solution significantly reduced the time engineers spent troubleshooting.
Key takeaways include:
- The Power of Clarity: Even in complex systems, clear design principles lead to faster issue resolution.
- Automation for Efficiency: Grouping similar errors automatically made a huge difference in how engineers prioritized and resolved issues.
- Balancing Data and Usability: Maintaining a visually clean design while presenting dense data sets was crucial in preventing cognitive overload.